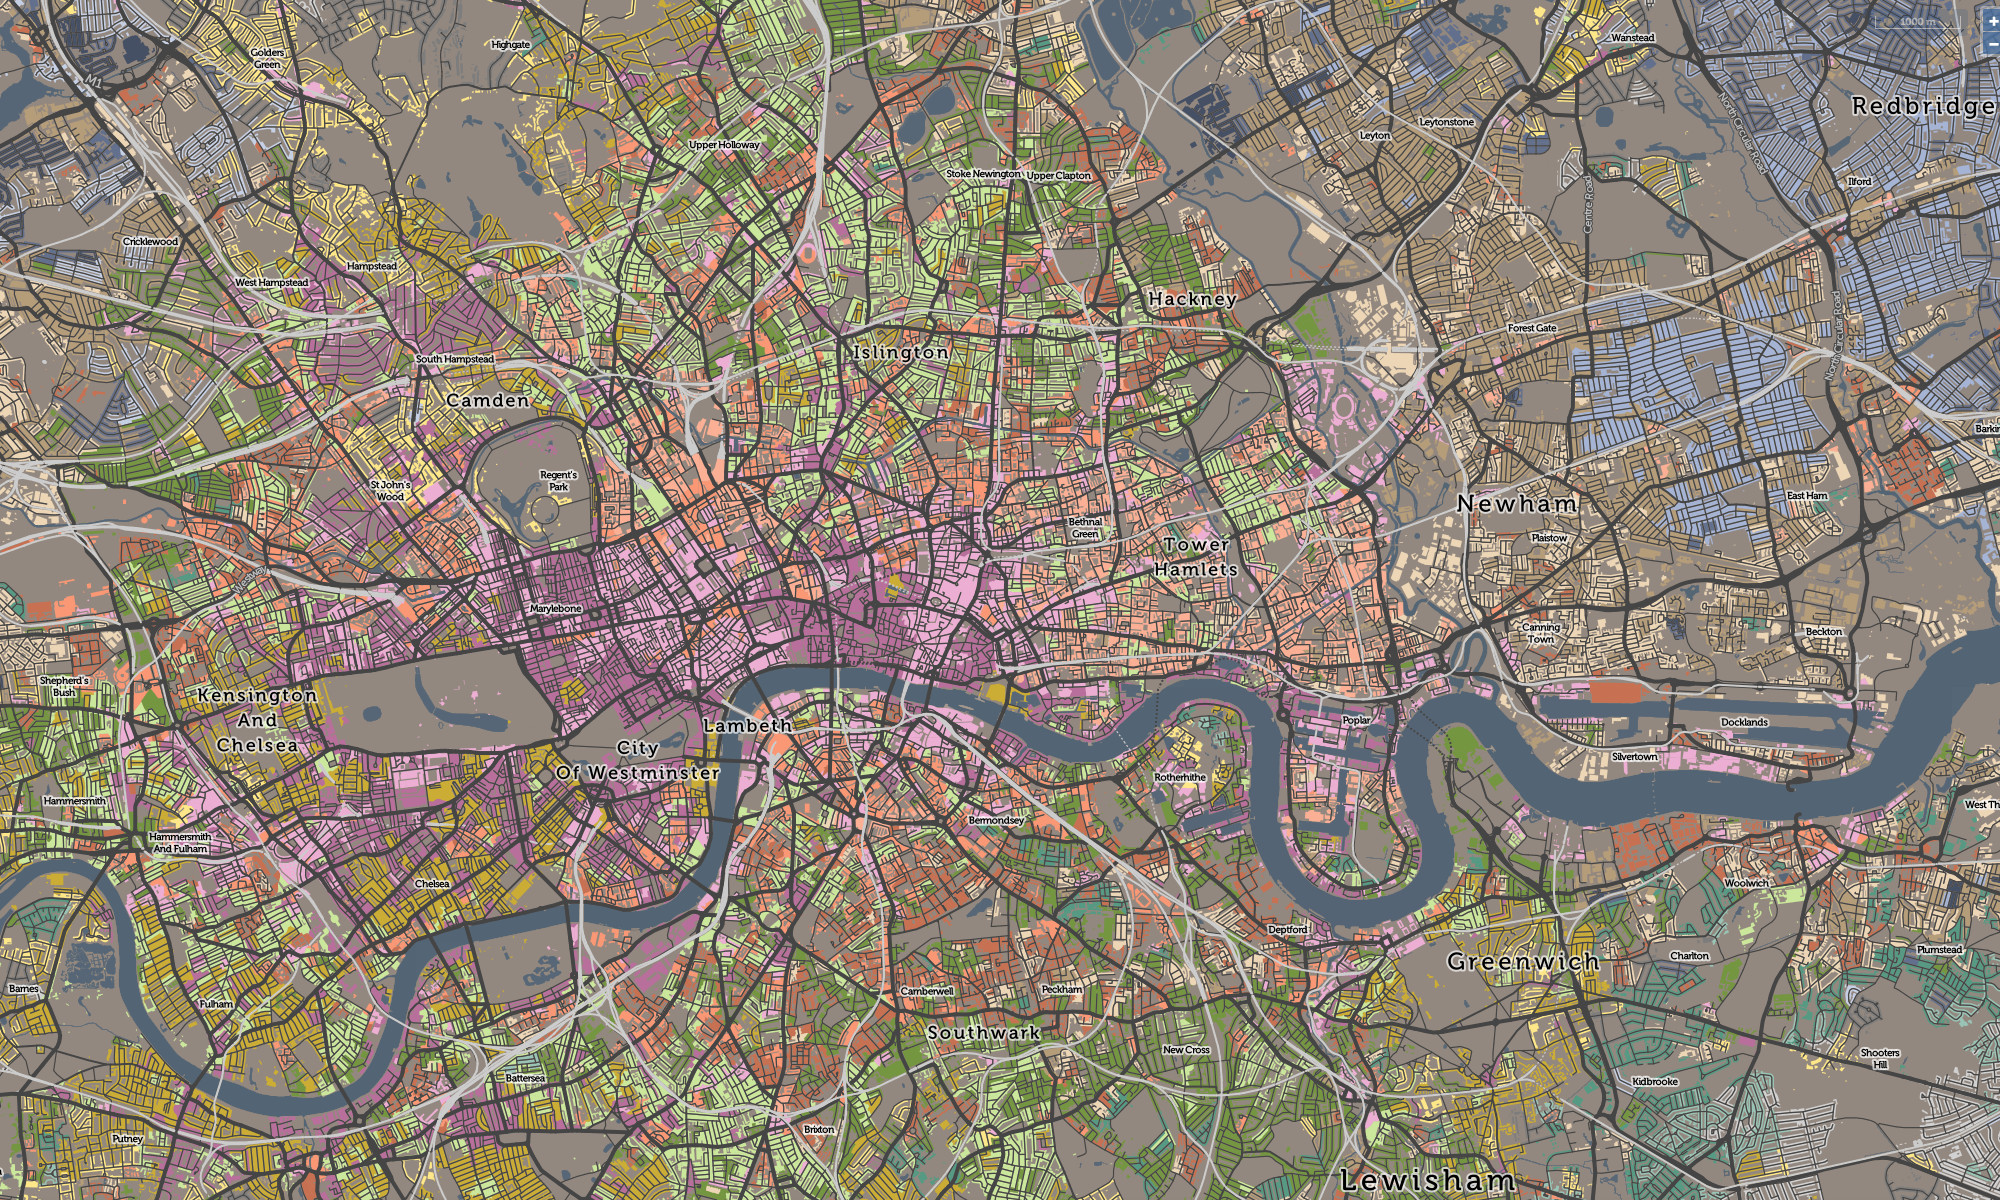
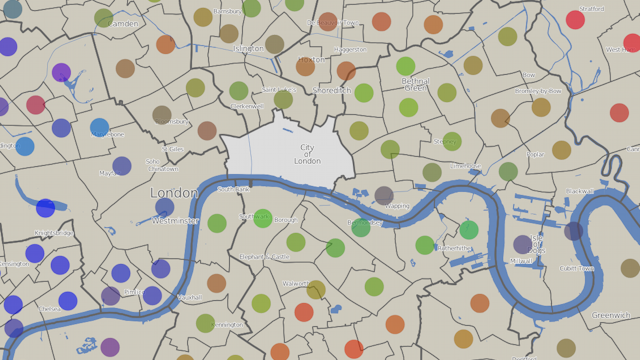
An interactive map showing the “colour” of each London ward, based on the results of the London Council Elections in May 2010. Each vote is considered to be red for Labour, blue for the Conservatives, and green for all other parties – the average “colour” can then be calculated and is displayed as a dot in the centre of each ward. The background is produced in Mapnik, with the circle symbology displayed using OpenLayers.
The visualisation can be viewed at http://casa.oobrien.com/misc/london/
Acknowledgements: Electoral data from the London Data Store. Ward and borough boundaries from Ordnance Survey Boundary-Line, part of the OS Open Data release. Contains Ordnance Survey data © Crown copyright and database right 2010. Background contextual data from OpenStreetMap, CC-By-SA OpenStreetMap and contributors.