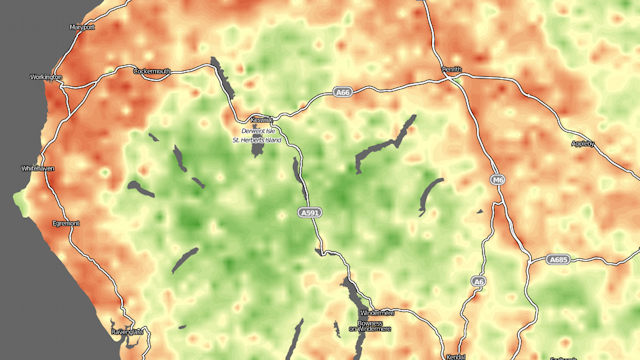
This map was created from the results of voting by visitors to the ScenicOrNot, who voted on a representative photo in each square kilometre of the UK, supplied by the Geograph project. A GIS was used to create a surface showing the results graphically. The more green an area, the more scenic it was judged to be. Redder areas scored lower.
The extract here shows the central Lake District, which scored very highly. The scores drop along the corridor created by the M6 motorway.
Acknowledgements: Voting results data from from MySociety ScenicOrNot. Contextual data from OpenStreetMap, CC-By-SA OpenStreetMap and contributors.
Current status: Offline.