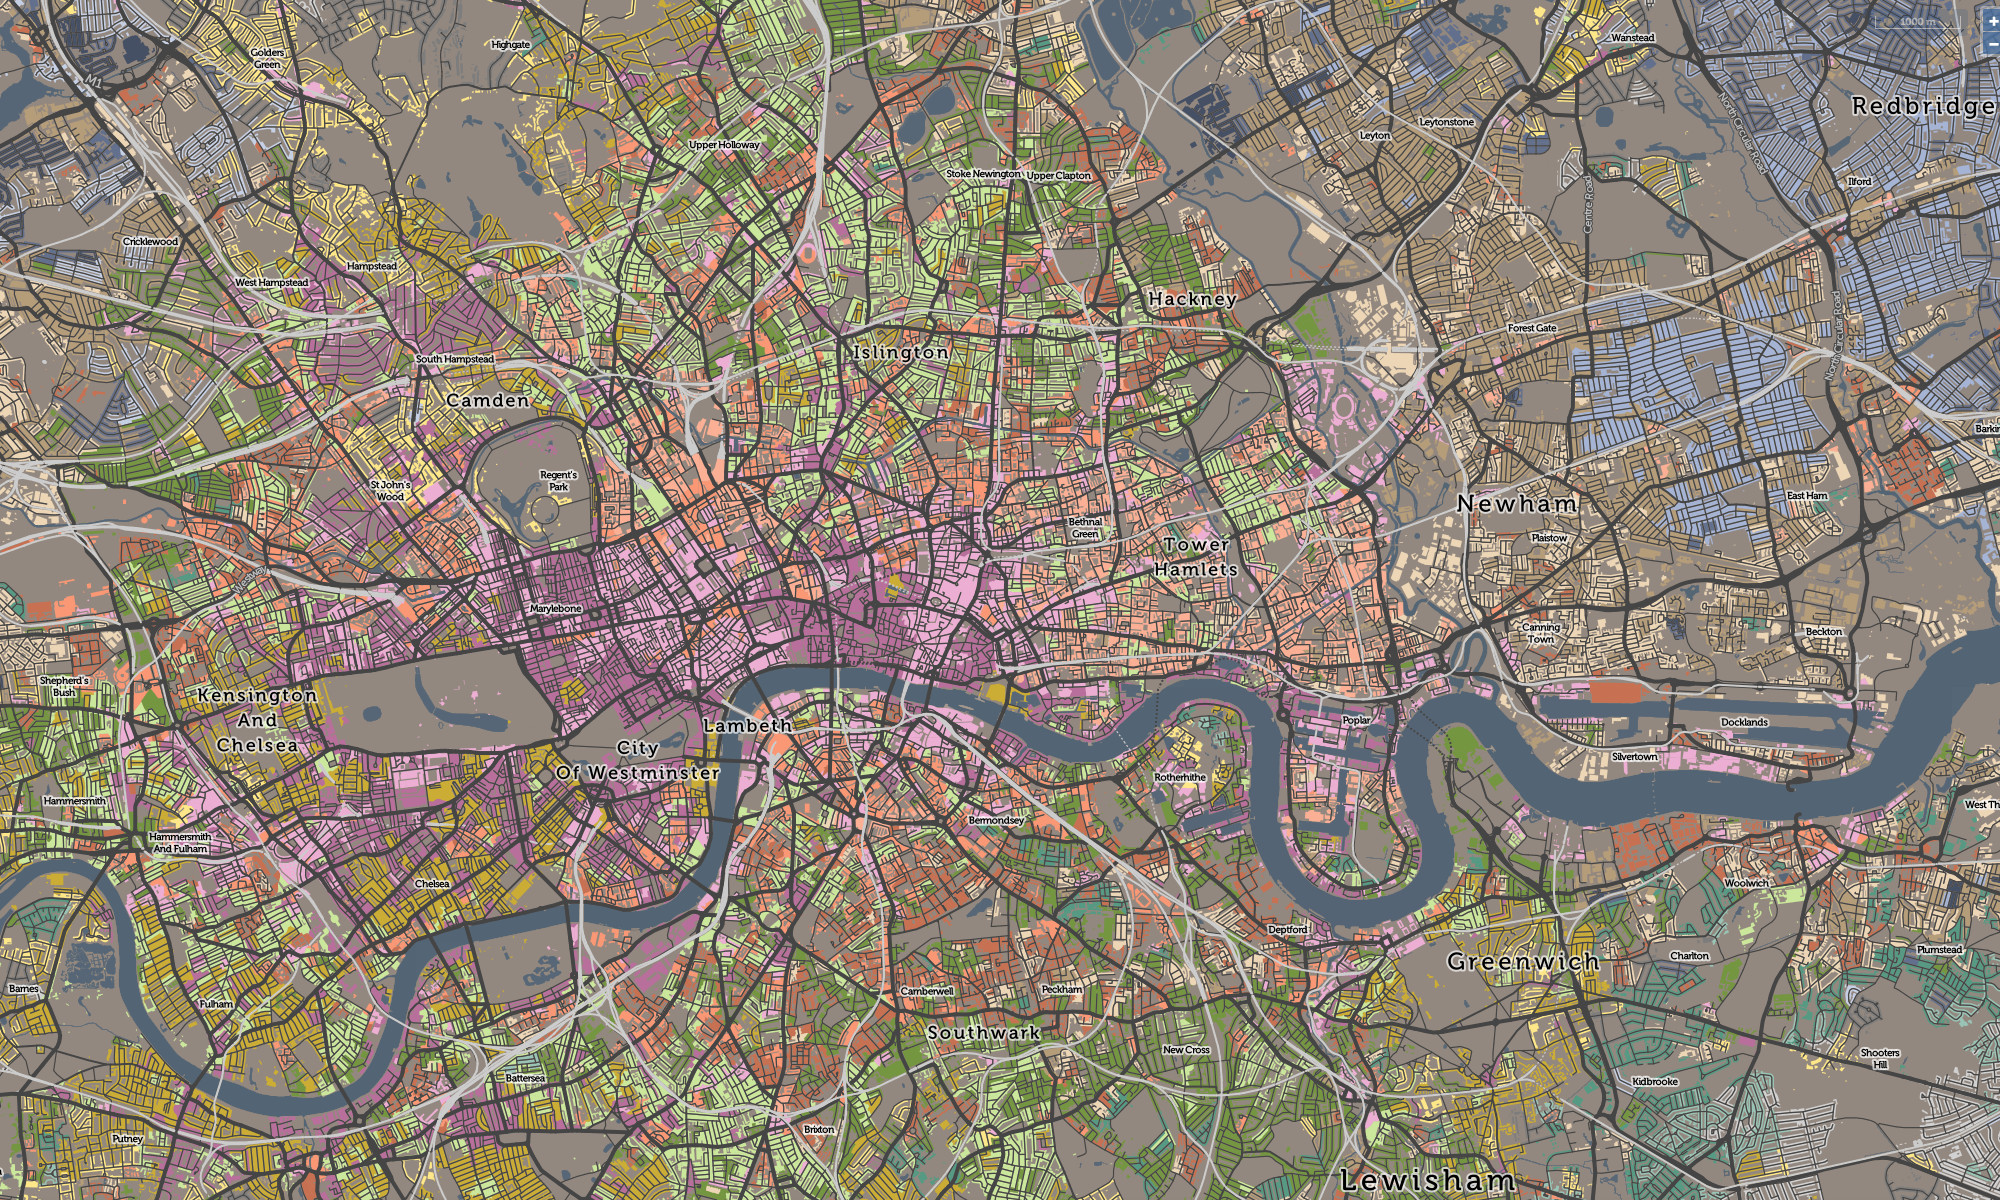
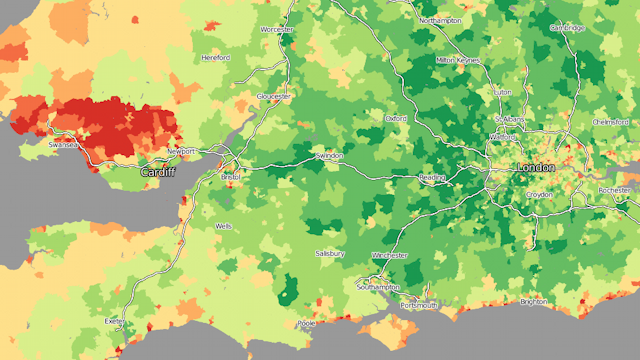
This choropleth map shows the results of the 2001 census question on health – in the greener areas, a greater proportion of the population in each statistical area consider themselves to be of good health, with redder areas indicating smaller proportions. The difference between the rural areas west of London, and north of Cardiff, are striking. A similar disparity can be seen when comparing east and west London.
Medium: Web. Acknowledgements: Census data is from the 2001 Census Area Statistics tables. Crown copyright 2003. Crown copyright material is reproduced with the permission of the Controller of HMSO. Statistical area boundaries from UKBORDERS, an EDINA-supplied service. Contains Ordnance Survey data © Crown copyright and database right 2010. Contextual data from OpenStreetMap, CC-By-SA OpenStreetMap and contributors.