Skip to content

Oliver O'Brien

Spatial Data Visualisation Portfolio

  • Mini CV
  • Contact
  • About
  • Research Blog
  • Personal Blog
Posted on 14 June 201323 October 2013 by Oliver O'Brien

The London Periodic Table

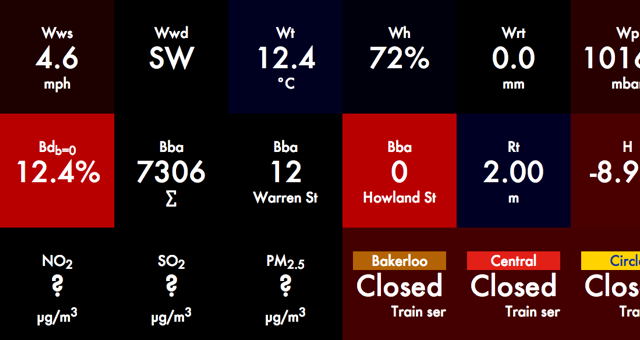
An alternative view of CityDashboard data for London, using its API. Styled with coloured, glowing squares, with deliberately vague captions to encourage the viewer to think about what they mean. It can be viewed at http://casa.oobrien.com/periodictable/

CategoriesLondon, Visualisation

Post navigation

Previous PostPrevious UK General Election – Swing Map
Next PostNext Oyster Card Touches for a Weekday
Proudly powered by WordPress