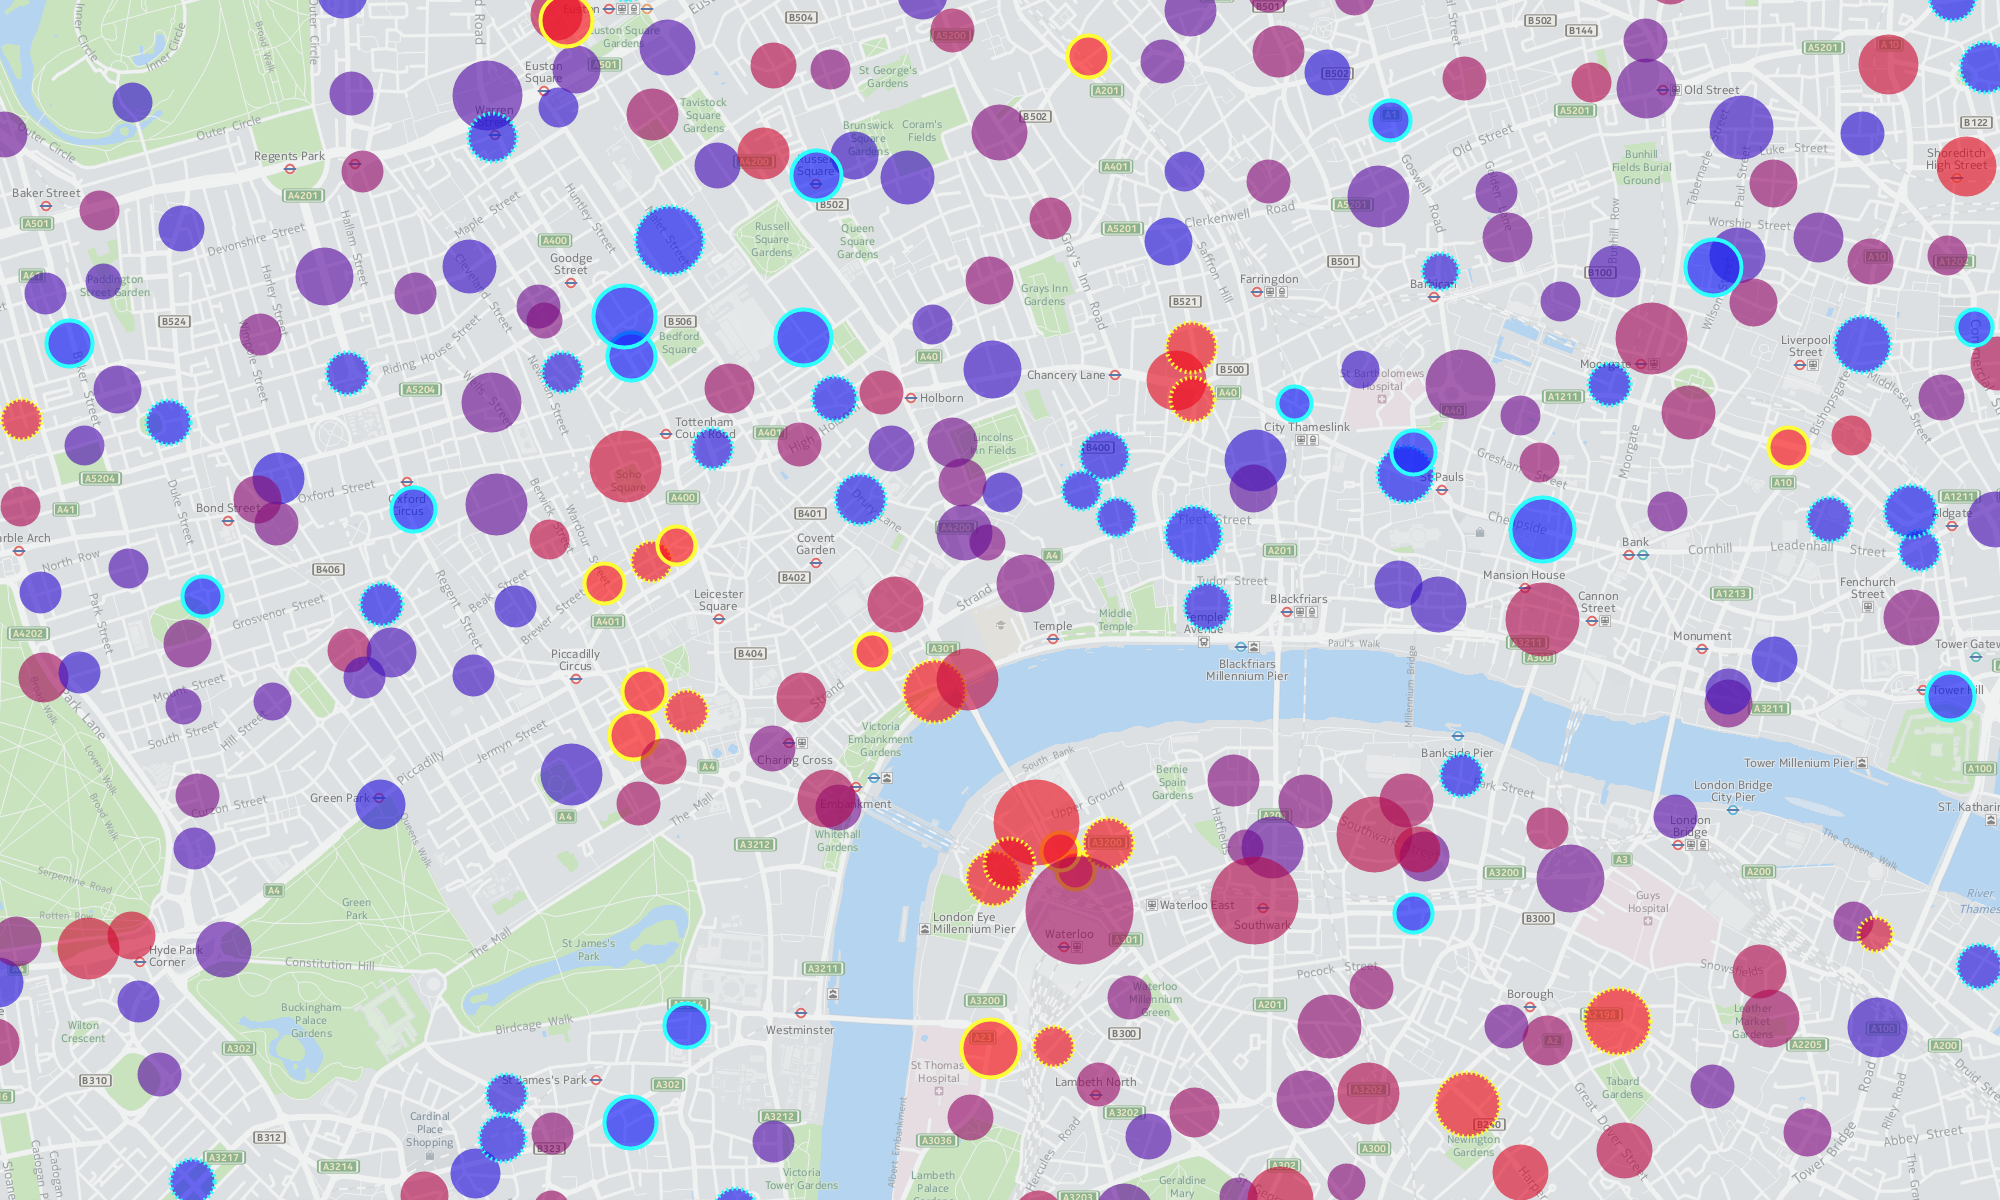
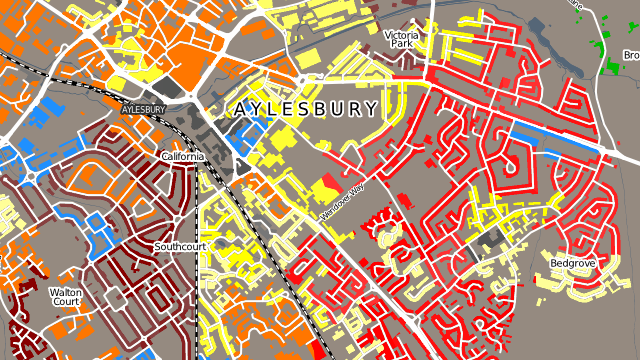
The Booth Map of London poverty, c. 1889, was groundbreaking, in that it individually coloured each house according to the assessor’s result. By applying this technique (a form of dasymetric mapping) to two more modern datasets (the Output Area Classification of Great Britain based on the 2001 Census, and the Index of Multiple Deprivation for England 2010) we can similarly colour in the buildings, while leaving the uninhabited parks and fells free of distracting colour.
Acknowledgements: Contains Ordnance Survey data © Crown copyright and database right 2011. Data from the ONS.